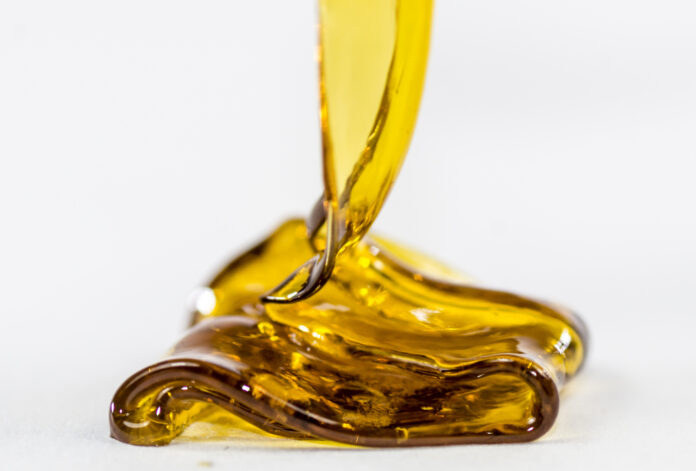
Cannabis Concentrates are a lot like the orange juice concentrate in your fridge—both are the results of extracting the best parts of the plant to yield even higher potency. In the case of cannabis, cannabinoids (THC in particular) often are prioritized for high potency. From the simple use of pressure and heat to create rosin to the more sophisticated solvent-based extraction process for distillates, there are a variety of ways concentrates can be produced. Different extraction methods create different consistencies as well, ranging from glass-like “shatter” to thick, icing-like “budder.”
The concentrate category is important in both the United States and Canada, but consumer buying preferences within the concentrates category vary greatly. First, concentrates hold more of the market in the U.S. than in Canada. In the U.S., concentrates account for 9.5 percent of total cannabis sales — 6.6 percent more market share than in Canada, where the category has only 2.9 percent of the market.
Within the concentrates category, hash is more popular in Canada with 26 percent market share; live resin leads in the U.S. with 33 percent of sales within the category. In terms of packaging, consumers in the U.S. prefer a one-gram package size, which accounts for 96 percent of units sold — significantly higher than Canada’s 71 percent. As for strains, 17.9 percent of Canadian consumers say their favorite straing is “indica-only” while GG#4 holds the top spot in the U.S., though with only 1.4% market share.
All sales, market share, unit volume, pricing, and demographic data for this report are sourced directly from Headset Insights. Graphs labeled “2021 YTD” cover the period between January 1 and June 30, 2021.
Market share of cannabis categories by country
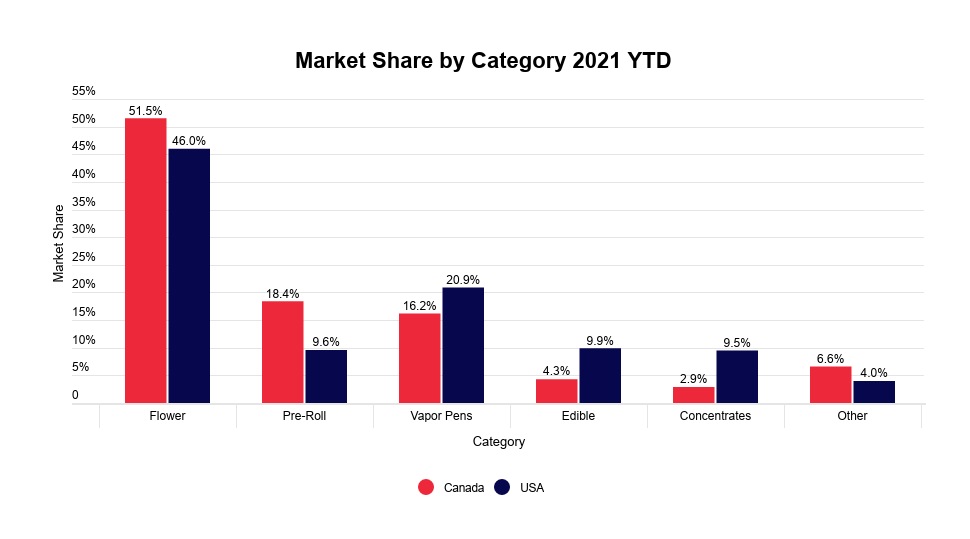
When we focus on concentrates from January through June 2021, we see the U.S. prefers concentrates much more than Canada, boasting 6.6 percent greater market share. In both countries, concentrates land in the fifth-most-popular-spot, only 0.4 percent behind edibles and well behind flower, the dominant category. Flower’s market share has fallen in Canada since “cannabis 2.0” products rolled out, now holding 51.5 percent of the market, while vapor pens, edibles, and concentrates are gaining traction.
Market share of cannabis concentrates by country
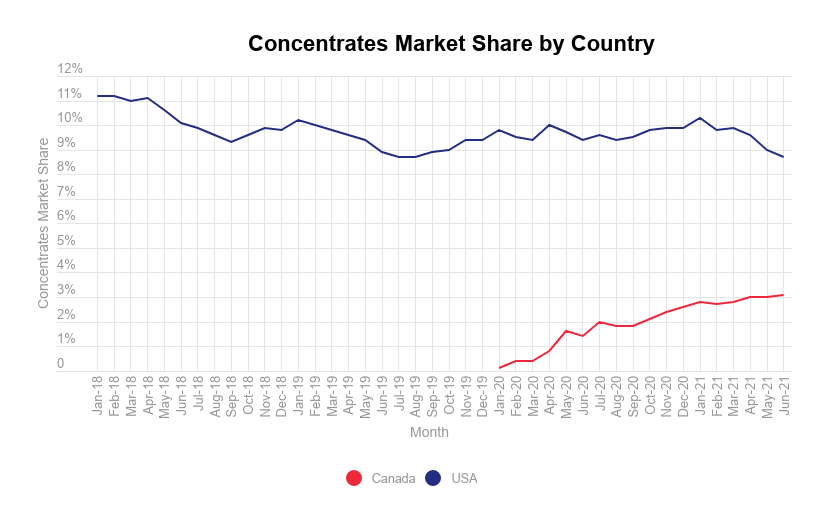
Though declining in the third quarter of 2021, the concentrates market in the U.S. continues to have a greater share than Canada, by more than a 5-percent margin. After the release of cannabis 2.0 categories, concentrates market share in Canada grew quickly and continues to trend upwards, gaining roughly 3 percent in the past eighteen months.
Market share of concentrates by state and province
It is important to remember there are significant differences between cannabis laws and regulations in the U.S. and Canada when comparing concentrates market share across states and provinces. For example, Pennsylvania law prohibits some categories, including pre-rolls, since smoking cannabis flower remains illegal in the state; flower may be consumed only via vaporization. So, unsurprisingly, Pennsylvania leads the concentrate market because of its unique, medical-only consumption regulations that lead to increased vaporization use.
Sales share of concentrate segments by country
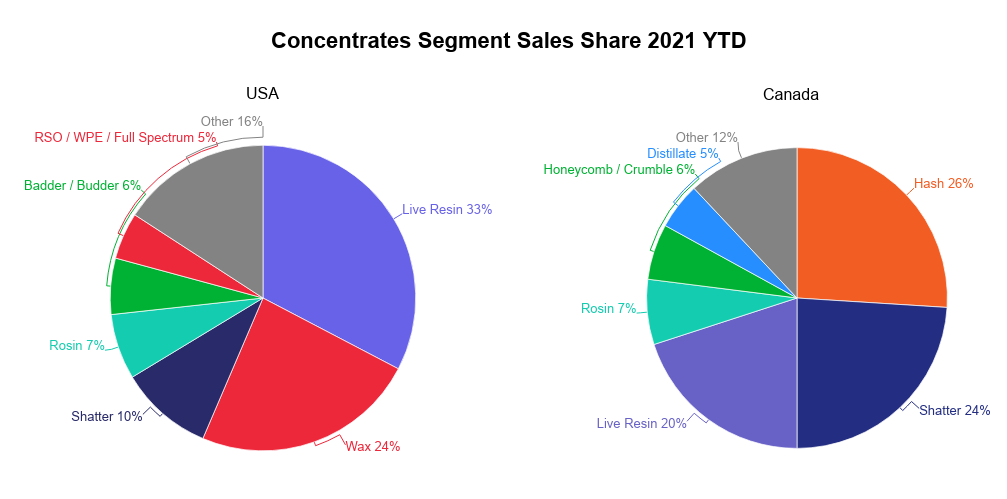
When breaking down the sales share of concentrates by country through June 2021, live resin and wax dominated the U.S. market with 33 percent and 24 percent share, respectively. Hash stayed at the top in Canada at 26 percent, followed by shatter at 24 percent. This graph illustrates the clear difference in preference in each country, as shatter is a top performer in Canada but holds only 14 percent of the market in the U.S.
Package sizes by country
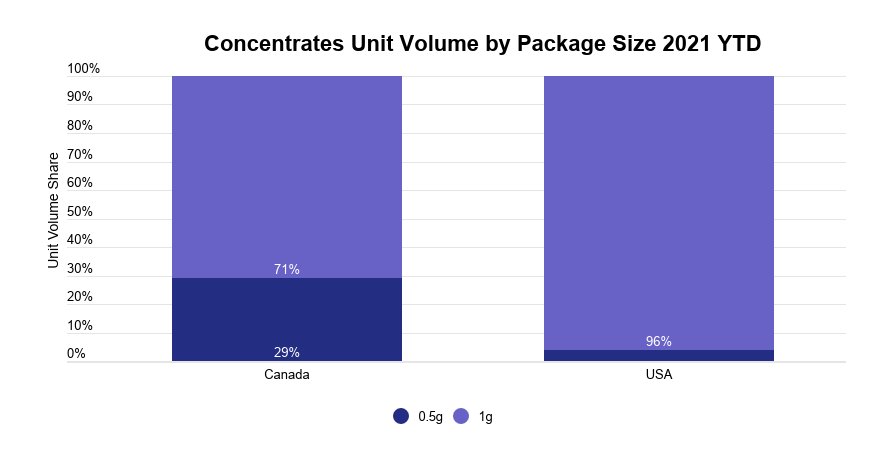
Package size preferences in each country show a stark contrast: The U.S. clearly prefers a one-gram size as opposed to a half gram, with the former holding 96 percent of the market. It is a bit more split in Canada, where 29 percent of the market share goes to half-gram packages.
Average price by segment in the U.S.
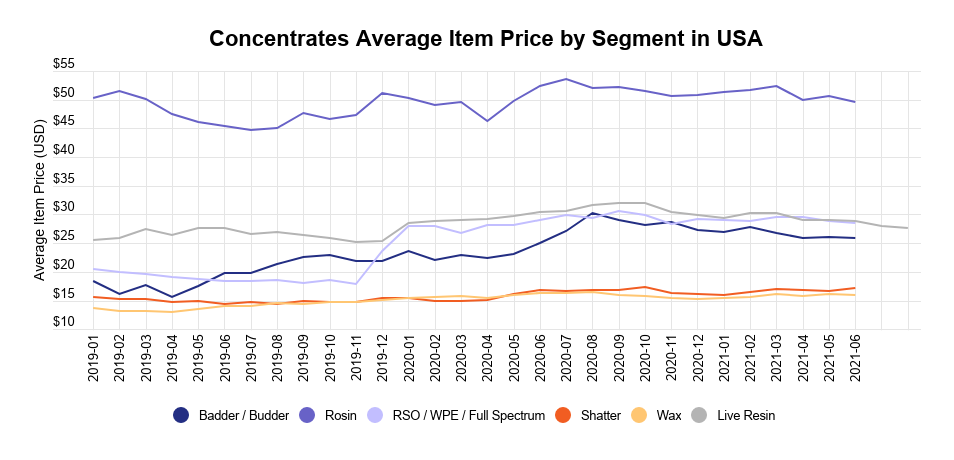
Concentrate prices tend to stay below the $35 mark in the U.S. Popular categories like live resin, shatter and wax have remained consistent in pricing, while segments like Rick Simpson oil and similar preparations jumped from $20 to $30 in 2020. Rosin showed the highest average prices (more than $50) despite holding only 7 percent of the market, indicating consumers may be willing to pay extra for a solventless product.
Wallet share by demographic group in the U.S.
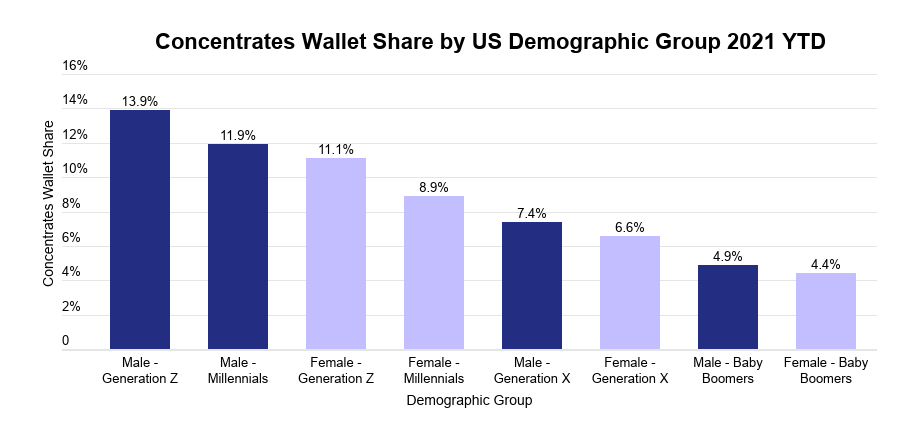
Gen Z males have proven to be the top consumers of concentrates, contributing 14 percent of total sales to the category. Male millennials follow close behind with 11.9 percent of wallet share for concentrates.
In this category, it’s clear the older the demographic, the smaller the wallet share. Baby Boomer, who contribute just 5 percent to the category’s sales. Regardless of the age group, male consumers consistently have a higher wallet share for concentrates than their female counterparts.
Market share of top concentrate strain by country
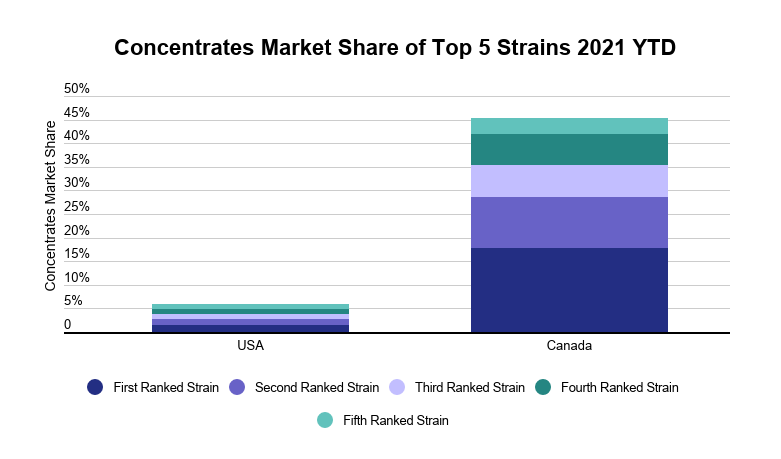
In this graph, it is worth noting the U.S. cannabis market sells significantly more strains than Canada, resulting in lower market shares per strain. “Indica-only,” Canada’s top strain, holds 17.9 percent of the market, compared to the U.S. top seller GG#4 at 1.4 percent.
Conclusion
While cannabis concentrates may be a smaller category, it is unique and worth keeping an eye on within the U.S. and Canadian markets.
Key Takeaways
- Concentrates are more popular in the U.S. than in Canada, with a 6.6 percent greater market share to concentrates: The US has a 9.5-percent market share; Canada’s is 2.9 percent.
- U.S. and Canadian consumers have different preferences in terms of concentrates segments. Hash is the top seller in Canada, while live resin has the top spot in the U.S.
- Preference varies by age. The older the demographic, the lower their wallet share to concentrates. Male customers buy more than female customers.

Cy Scott is co-founder and chief executive officer at Headset Inc., turning retail data into real-time cannabis market insights. He provides industry analysis and insights about innovative brands through his weekly blog, Cannabis Packaged Goods. Prior to founding Headset, he co-founded Leafly and helped grow the site into the world’s leading cannabis information resource. Along with his work at Headset, Scott founded a monthly Cannabis Tech Meetup hosting cannabis entrepreneurs and technology developers that has expanded into multiple regions throughout the U.S. Scott’s favorite strain is Tangie.






[…] will continue to expand. Trend data indicates concentrates, edibles, and vapes account for roughly 40 percent of total sales in the United States, with Generation Z and millennials contributing the most to spending in that […]
[…] relied heavily on manual processes. As recreational use becomes legal in more states and consumer demand for products like vape cartridges increases, many companies are scurrying to keep up and stay […]