


BDS Analytics director of dispensary relations Greg Shoenfeld on year-to-year growth, the categories he’s most bullish on, why flower is rapidly losing market share, and the coming concentrates revolution.
BDS Analytics launched in 2015 with a simple mission: to provide business intelligence, data, and market share tracking for the evolving cannabis industry. Founded by former McKinsey consultant Roy Bingham and veteran retail analyst Liz Stahura, BDS has become a premiere source for valuable business information. Greg Shoenfeld, 38, joined the company in August 2015 as the director of dispensary relations. Previously, he had been the retail relations manager at Leisure Trends Group, a Boulder, Colorado-based market research company. “At Leisure Trends, I was responsible for the development of retail partnerships in the cycling, outdoor, run, scuba dive, and snow sports industries,” he said.

What can dispensary owners expect when subscribing to BDS Analytics data reports?
Businesses generally know everything, or at least a lot, about their own business. But in a competitive market, knowing what is happening at an industry level and where your business stands is far more difficult without a service like BDS Analytics. It’s hard to argue with numbers—and that’s what BDS Analytics is all about.
For a dispensary, BDS Analytics provides the ability to benchmark your business versus the industry, in order to quickly identify what categories are underperforming the market and what will help you drive sales growth and increase margins. For brands, manufacturers, and cultivators who subscribe to BDS reporting for their relevant categories, the ability to measure the size of market and performance of their products in relation to competitors is critical.
On a scale of 1 to 10, where is the cannabis industry right now in terms of having access to good data?
That’s a great question. This is a young industry. On a scale of 1 to 10, I’d say the cannabis industry is at a 4 right now. Cannabis is moving fast, and distractions are everywhere. One must invest resources and time to effectively leverage data, and thus far, cannabis data has mostly taken a back seat to other business priorities. As the saying goes, “One year in cannabis is like six years elsewhere.”
How do you collect data?
BDS Analytics develops confidential relationships with partner dispensaries. Those dispensaries provide monthly sales and inventory reports generated by their POS systems. There are a range of POS providers with varying reporting capabilities. In an effort to maximize our data pool, we are fully automated and integrated with some systems, and in other cases we accept data that is manually generated.
No two stores enter products the same way in their POS, so the real magic at BDS Analytics is the effort and systems employed to cleanse and translate sales from hundreds of retailers into a uniform format.
BDS Analytics currently provides reporting for Colorado, Oregon, and Washington. We are actively building out capabilities in additional states, too. We receive data from nearly 600 dispensaries in the states we serve, have already processed over 50 million transactions, and are currently processing about 5 million transactions a month.
What are your impressions about how 2016 has shaped up so far for the following categories?
Flower: Flower remains the largest category sold at dispensaries, but the question is for how long? Across adult-use and medical sales in Colorado, Oregon, and Washington, flower sales represented 60 percent of sales in 2016 [to date], but despite continued growth, flower’s share of the market is declining. There’s much faster growth coming from concentrates, edibles, topicals, and even smaller categories like pet products. Contributing to flower’s falling share is the fact that prices for flower have declined steadily following the decline in wholesale prices. Year to date in 2016, the average gram of flower across all channels and states tracked by BDS Analytics was selling for $6.88, down from $7.57 in the previous year.
Concentrates: Concentrates represent a true revolution in cannabis. In 2016, 67 percent of the growth in the market was driven by concentrates in the various forms. The category more than doubled in size. Across all states and channels, concentrates account for 22 percent of the sales year-to-date in 2016, up from 15 percent in 2015. In Colorado’s medical market concentrates accounted for over 29 percent of the business. In June of 2016, Oregon dispensaries were provisionally selling concentrates to adult-use customers for the first time. In June concentrates accounted for 17 percent of adult-use sales in Oregon, indicating consumer trends are evolving rapidly.
Vape: There is no doubt that vaping is big and getting bigger. BDS Analytics classifies vaping products under pre-filled cartridges and disposable pens within the concentrates category; they are the largest sub-category, representing 35 percent of all concentrate sales. With year-to-date growth of 123 percent, the subcategory is contributing 30 percent of the growth in concentrates. The rapid growth within the category has led to the proliferation of brands and products. BDS Analytics dispensary partners have sold vape products from over 200 brands in 2016.
Edibles: Year to date, edibles have accounted for 10.5 percent of sales across all states and channels, a modest increase from 10 percent the previous year. In Colorado adult-use locations, edibles now account for almost 14 percent of sales. But since January 2014, the category has consistently contributed between 11 percent and 14 percent of total sales. The regulatory environment in each state has a significant impact on the mix of sales within edibles. Gummies are the top-selling variety of edibles in Colorado, whereas chocolates are the favorite of consumers and patients in Washington.
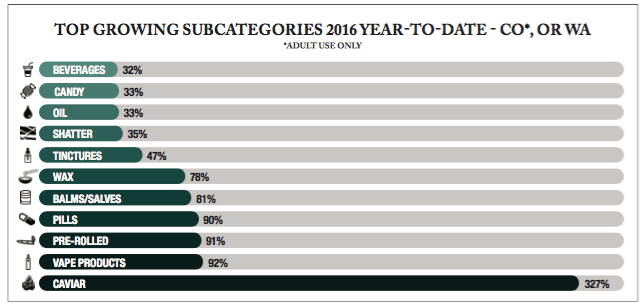 Shatter: After vape-related products, shatter is the next largest subcategory within concentrates. Across all states and channels, shatter accounts for 21 percent of sales in the concentrate category; shatter sales have grown 84 percent in 2016. In Colorado’s medical dispensaries, shatter is the largest of the concentrate subcategories, accounting for 29 percent of all concentrate sales.
CBD: CBD-related products are proliferating, with new offerings appearing frequently. For now, the contribution of sales from CBD-related products is less than 2 percent of the market. The majority of dispensaries tend to limit the selection of high-CBD flower strains to one or two choices, and within other categories there tends to be equally limited selection. Tinctures, flower, and pills are the top-selling categories of products containing high levels of CBD.
Accessories: An interesting dynamic of cannabis’s long presence in the black market is that head shops, online retailers, and even gas stations have long supplied the demand for cannabis-related accessories. Dispensaries have done little to capture that business. Accessories represent a little over 1 percent of sales, and with just 20 percent growth, the category’s contribution to total revenue is declining. Within accessories, handheld vaporizers are the largest contributor of sales.

I’m bullish on categories that allow for discrete consumption of cannabis. Edibles and vaping are where the action will be. In vaping, the increased availability of strain-specific oils and cleaner oils absent additives like PEG (Polyethylene glycol) will broaden the audience. Also, more options in solventless concentrates like rosin are likely to appeal to more health-conscious consumers.
What trends do you see taking shape in 2017?
Most categories will continue to grow, but faster growth in edibles and concentrates will increase their combined share to nearly 50 percent of the market. Price reductions in adult-use markets will continue to cannibalize sales from medical dispensaries as patients choose to forgo renewing their medical cards. Increased competition, as well as more stringent compliance rules and regulations, will increase the complexity and cost of operating a dispensary. The need to develop operational efficiencies will drive increased consolidation in the market. As the perceived risk of investing in cannabis diminishes, the influx of capital will allow larger brands to emerge across multiple states.
